
Scientific ADC research: On-chip energy per sample vs. ENOB. Current state-of-the-art highlighted.
ADC ENERGY EFFICIENCY LIMITS (Updated): A significant part of the ADC community seems to be focused on improving the energy efficiency of data converters. Essentially getting the same job done at ever decreasing energy costs. I’m sure that many of you are trying to figure out what is the absolute limit in the power-performance trade-off. Is it only our imagination or will thermal noise or some other law of physics finally stop us from improving the energy efficiency of ADCs? Well, I will not claim to give the full answer to that. What we will do, however, is to take an empirical look at where the field is today, check if the current state-of-the-art boundaries resemble any familiar theory, and observe how the energy efficiency is influenced by certain design choices and parameters. Since that might be a rather hefty undertaking, we will start out slow and let it all evolve over several blog posts.
What is “energy efficiency”?
First of all, we need to define how to measure energy efficiency. Energy efficiency in this context is about the trade-off between the performance you get and the power you burn. Performance typically means the simultaneous combination of speed and resolution. We will use the equivalent Nyquist sampling rate (fs) to measure speed, and the effective-number-of-bits (ENOB) to measure resolution.

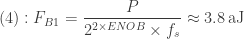
In order to evaluate the success of power-performance trade-offs, a large number of figures-of-merits (FOM) have been proposed in the literature [1]. A common feature of many FOM is that the power dissipation is normalized by the sampling rate into the expression energy-per-sample

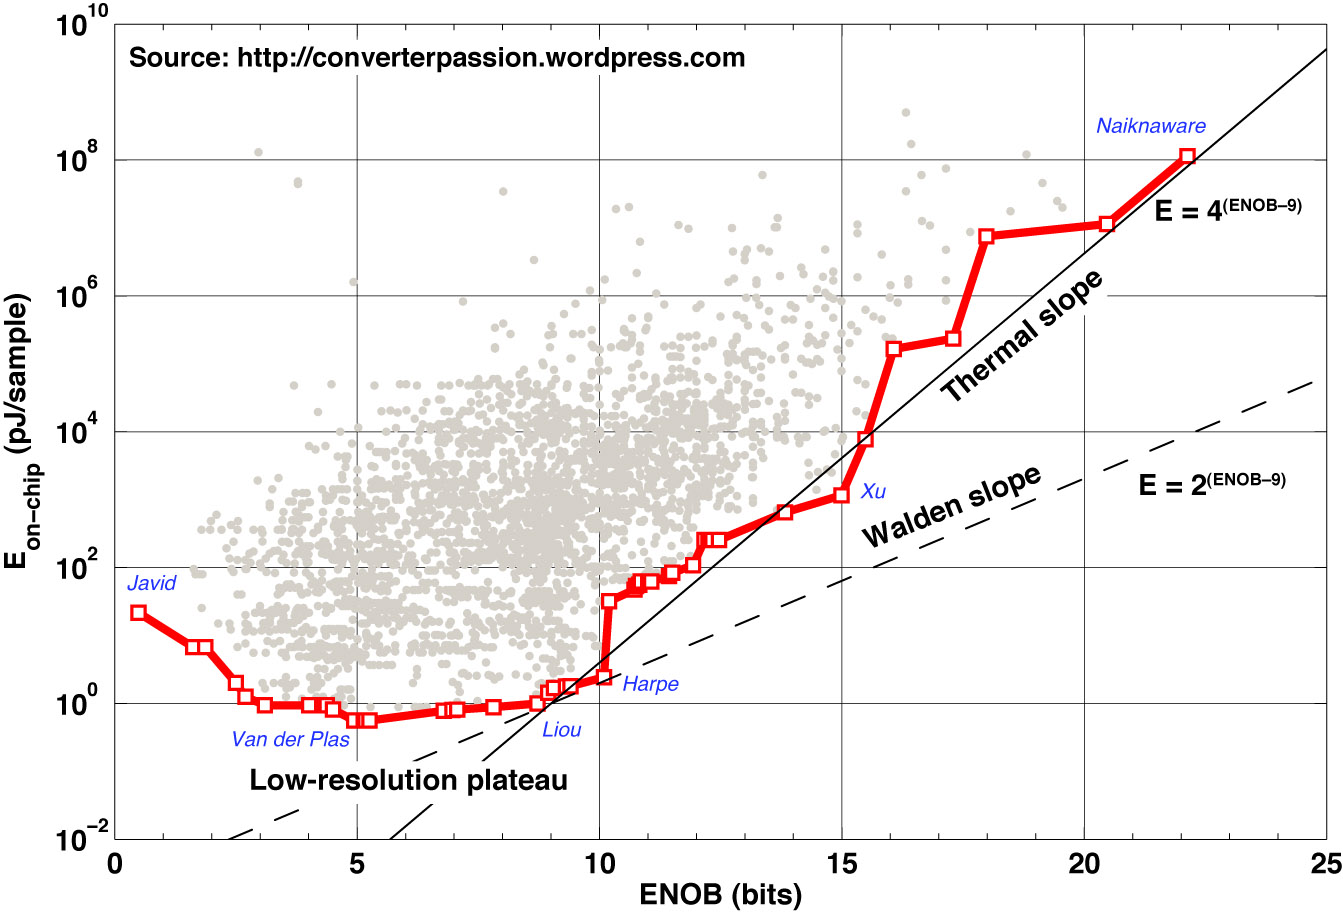
The starting point for this treatment will therefore be to look at Es vs. ENOB, as plotted in Fig. 1.
The ADC energy landscape
Figure 1 gives a helicopter view of the ADC energy landscape. It shows the energy-per-sample vs. effective resolution for nearly all implementations reported scientifically since 1974 and to this date. The current state-of-the-art envelope is highlighted, and key corner points are indicated with first-author names [2]-[7].
The energy slopes
Two lines have been superimposed as visual guides, and to support the discussion: As mentioned in various publications, e.g., [8]-[11], the power dissipation will quadruple for every effective bit of resolution if the ADC power is limited by thermal noise constraints (e.g., kT/C capacitor sizing), and the architecture is otherwise unchanged [12]. The solid line is therefore
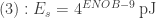
and has been labeled the Thermal slope. It is equivalent to a constant Thermal FOM
The second visual guide (dashed) is
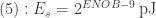
and was labeled the Walden slope because it corresponds to a doubling of power dissipation for every additional bit of resolution, as suggested by the Walden FOM. The dashed line corresponds to a constant Walden FOM
The term “–9” is arbitrarily chosen in order to get expressions that are easy to remember and that intersect Es = 1 pJ @ ENOB = 9-b, which is a relevant energy point approximately on the state-of-the-art border.
The low-resolution plateau
As seen in Fig. 1, energy-per-sample levels out to an almost constant value for low resolutions. This Low-resolution plateau is rather puzzling. While degradation below 3-b may be due to lack of data, it doesn’t appear to be any lack of attempts between 3–8 bits. Intuitively, I would not expect Es to be practically independent of ENOB from 8-b and below. Would you? I would expect it to continue to decrease with resolution, but possibly at a slower rate than the thermal slope dictates.
I do have some thoughts on how this may depend on what ADC specs scientists have chosen to target, but it would be very interesting to hear your thoughts on the plateau.
The empirical data vs. the slopes
The “slopes” in Fig. 1 represent the energy-vs.-performance models suggested by the two figures-of-merit FA1 and FB1. As you can see, the thermal slope aligns very well with the state-of-the-art boundary for ENOB ≥ 9-b. There is a fair amount of randomness in the state-of-the-art progress that causes it to zigzag around the ideal model, but the thermal-noise energy model seems to be able to predict the overall slope of the curve from 9-b and above. This should be quite uncontroversial, as it is commonly understood that the power dissipation of high-resolution ADCs is limited by thermal-noise constraints. It should however be noted that recent works seem to extend this relation even to resolutions as low as 9–10-b ENOB.
Regarding the Walden slope, my interpretation is that it fails to fit to the empirical data within in any significant range of resolution, except possibly for the roughly 1-b wide region between Liou [4] and Harpe [5] where the overall curve (according to my interpretation) is in a state of transition from thermal-noise limited to approximately constant. There is also a region between 10–15 bits where the slope is almost identical to the Walden model. To the best of my understanding, this is an inevitable effect of zigzagging around the thermal slope: Locally, the curve will alternate between segments with a more shallow slope (looking like Walden) and segments with a slope even steeper than predicted by the thermal-noise model.
Since I can’t unambiguously prove the above at this point, and since I know this can be a bit sensitive, I will remain open to the possibility that the Walden energy model could still be valid over some range of resolutions.
Please fee free to share your own thoughts and interpretations of the data.
Update: I clearly forgot to mention the theoretical predictions of SAR ADC energy bounds by Zhang, Svensson, and Alvandpour in [13]. Kind of a SAR version of [10]. Since SAR ADCs dominate large segments of the low-energy scene, the paper is extremely relevant to this post. On top of it, the theoretical predictions align very well with the empirical data in Fig. 1 above. (You can try yourself to overlay the two plots in Photoshop or similar)
Upcoming posts
In a few more posts on this topic, I intend to illustrate how the empirically observed ADC efficiency limits depend on parameters such as sampling rate, process node and year.
References
- B. E. Jonsson, “Using Figures-of-Merit to Evaluate Measured A/D-Converter Performance,” Proc. of 2011 IMEKO IWADC & IEEE ADC Forum, Orvieto, Italy, June 2011. [PDF @ IMEKO]
- B. Javid, and P. Heydari, “A 4-bit 12GS/s Data Acquisition System-on-Chip Including a Flash ADC and 4-Channel DeMUX in 130nm CMOS,” Proc. of IEEE Custom Integrated Circ. Conf. (CICC), San Jose, California, USA, pp. 1–4, Sept., 2012.
- G. Van der Plas and B. Verbruggen, “A 150 MS/s 133 µW 7 bit ADC in 90 nm Digital CMOS,” IEEE J. Solid-State Circuits, Vol. 43, pp. 2631-2640, Dec., 2008.
- C.-Y. Liou, and C.-C. Hsieh, “A 2.4-to-5.2fJ/conversion-step 10b 0.5-to-4MS/s SAR ADC with Charge-Average Switching DAC in 90nm CMOS,” Proc. of IEEE Solid-State Circ. Conf. (ISSCC), San Francisco, USA, pp. 280–281, Feb., 2013.
- P. Harpe, E. Cantatore, and A. van Roermund, “A 2.2/2.7fJ/conversion-step 10/12b 40kS/s SAR ADC with Data-Driven Noise Reduction,” Proc. of IEEE Solid-State Circ. Conf. (ISSCC), San Francisco, USA, pp. 270–271, Feb., 2013.
- J. Xu, X. Wu, M. Zhao, R. Fan, H. Wang, X. Ma, and B. Liu, “Ultra Low-FOM High-Precision ΔΣ Modulators with Fully-Clocked SO and Zero Static Power Quantizers,” Proc. of IEEE Custom Integrated Circ. Conf. (CICC), San Jose, California, USA, pp. 1–4, Sept., 2011.
- R. Naiknaware, and T. Fiez, “142dB ∆∑ ADC with a 100nV LSB in a 3V CMOS Process,” Proc. of IEEE Custom Integrated Circ. Conf. (CICC), Orlando, USA, pp. 5-8, May, 2000.
- A. M. A. Ali, C. Dillon, R. Sneed, A. S. Morgan, S. Bardsley, J. Kornblum, and L. Wu, “A 14-bit 125 MS/s IF/RF sampling pipelined ADC with 100 dB SFDR and 50 fs jitter,” IEEE J. Solid-State Circuits, Vol. 41, pp. 1846–1855, Aug, 2006.
- B. Murmann, “A/D converter trends: Power dissipation, scaling and digitally assisted architectures,” Proc. of IEEE Custom Integrated Circ. Conf. (CICC), San Jose, California, USA, pp. 105–112, Sept., 2008.
- T. Sundström, B. Murmann, and C. Svensson, “Power dissipation bounds for high-speed Nyquist analog-to-digital converters,” IEEE Trans. Circuits and Systems, pt. I, vol. 56, no. 3, pp. 509–518, Mar. 2009.
- B. E. Jonsson, “An empirical approach to finding energy efficient ADC architectures,” Proc. of 2011 IMEKO IWADC & IEEE ADC Forum, Orvieto, Italy, June 2011. [PDF @ IMEKO]
- K. Bult, “Embedded analog-to-digital converters,” Proc. of Eur. Solid-State Circ. Conf. (ESSCIRC), Athens, Greece, pp. 52–60, Sept., 2009.
- D. Zhang, C. Svensson, and A. Alvandpour, “Power consumption for SAR ADCs,” Proc. of Eur. Conf. Circ. Theory and Design (ECCTD), Linköping, Sweden, pp. 556–559, Aug., 2011.


Happy reading! I like the chosen number “-9” 😉
Regarding the low-resolution plateau, I think the process instead of the thermal noise will be a fundamental limit on the energy efficiency. That is to say, the C may refers to the minimum capacitance of a transistor in a process, and then the total C is architecture- and application- dependent. What’s more, most of the low-ENOB ADCs are particularly for high-speed applications, which indicates that power cost could be higher to achieve fast speed compared to moderate-ENOB/speed designs.
Thanks!
I believe like you, that the really low ENOB comes from ADCs which target much higher sampling rates (like tens of GSPS), and then the linear power model suggested by Es = P/fs is not really valid.
I’ll try to see if I can dig up empirical support for that, and I believe I can.
Unlike the 10-post long sequel on ADC evolution, however, I haven’t done all the work before I started posting this one. Only made some sneak previews to get some idea. Nerve-wrecking, indeed … 😉
Pingback: ADC Energy Efficiency: Nyquist vs. DSM | Converter Passion
Pingback: ADC Energy Efficiency Trends | Converter Passion